Configure Loki to log journald. Promtail configuration in the target hosts should contain something like:
scrape_configs:
...
  - job_name: journal
    journal:
      labels:
        host: nix
        job: systemd-journal
      max_age: 12h
    relabel_configs:
    - source_labels:
      - __journal__systemd_unit
      target_label: unit
To confirm ssh logs are being retrieved, in grafana explore use a query like:
{job="systemd-journal", unit=~"ssh.service|sshd.service"} |= ``
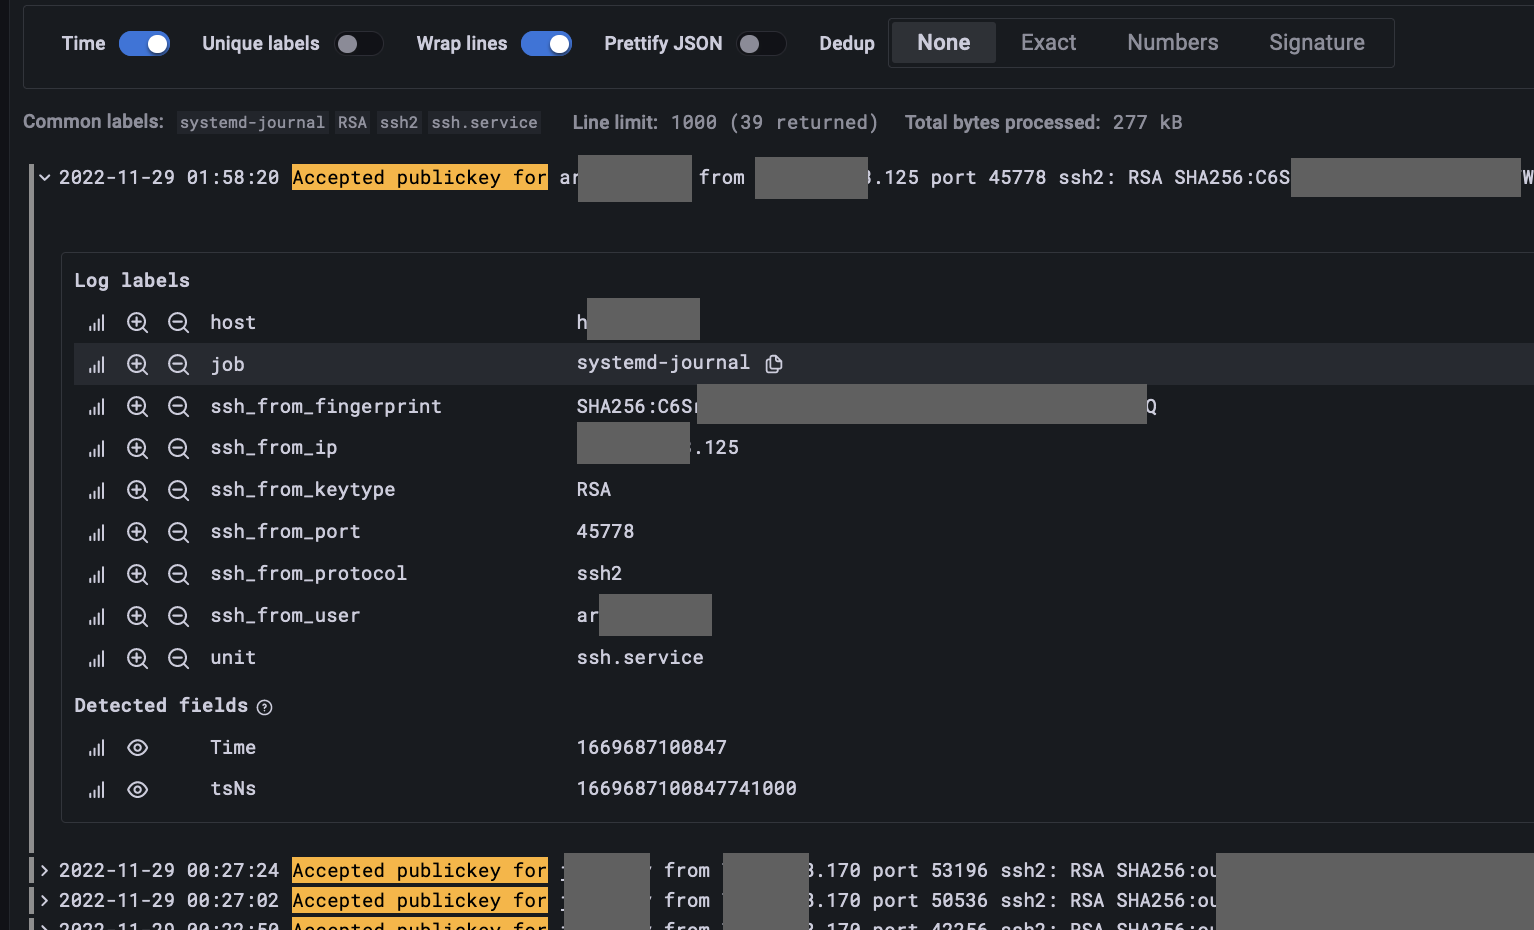
We are interested in the ssh login lines that start with “Accepted publickey for” since these lines contain the user, IP and ssh key fingerprint used:
{job="systemd-journal", unit=~"ssh.service|sshd.service"} |= `Accepted publickey for`
We can extract the information from the log line via a regexp. The following regexp will extract the values and assign to the designated labels:
{job="systemd-journal", unit=~"ssh.service|sshd.service"} |= `Accepted publickey for` | regexp `^Accepted publickey for (?P<ssh_from_user>\w+) from (?P<ssh_from_ip>\S+) port (?P<ssh_from_port>\S+) (?P<ssh_from_protocol>\S+) (?P<ssh_from_keytype>\S+) (?P<ssh_from_fingerprint>\S+)`
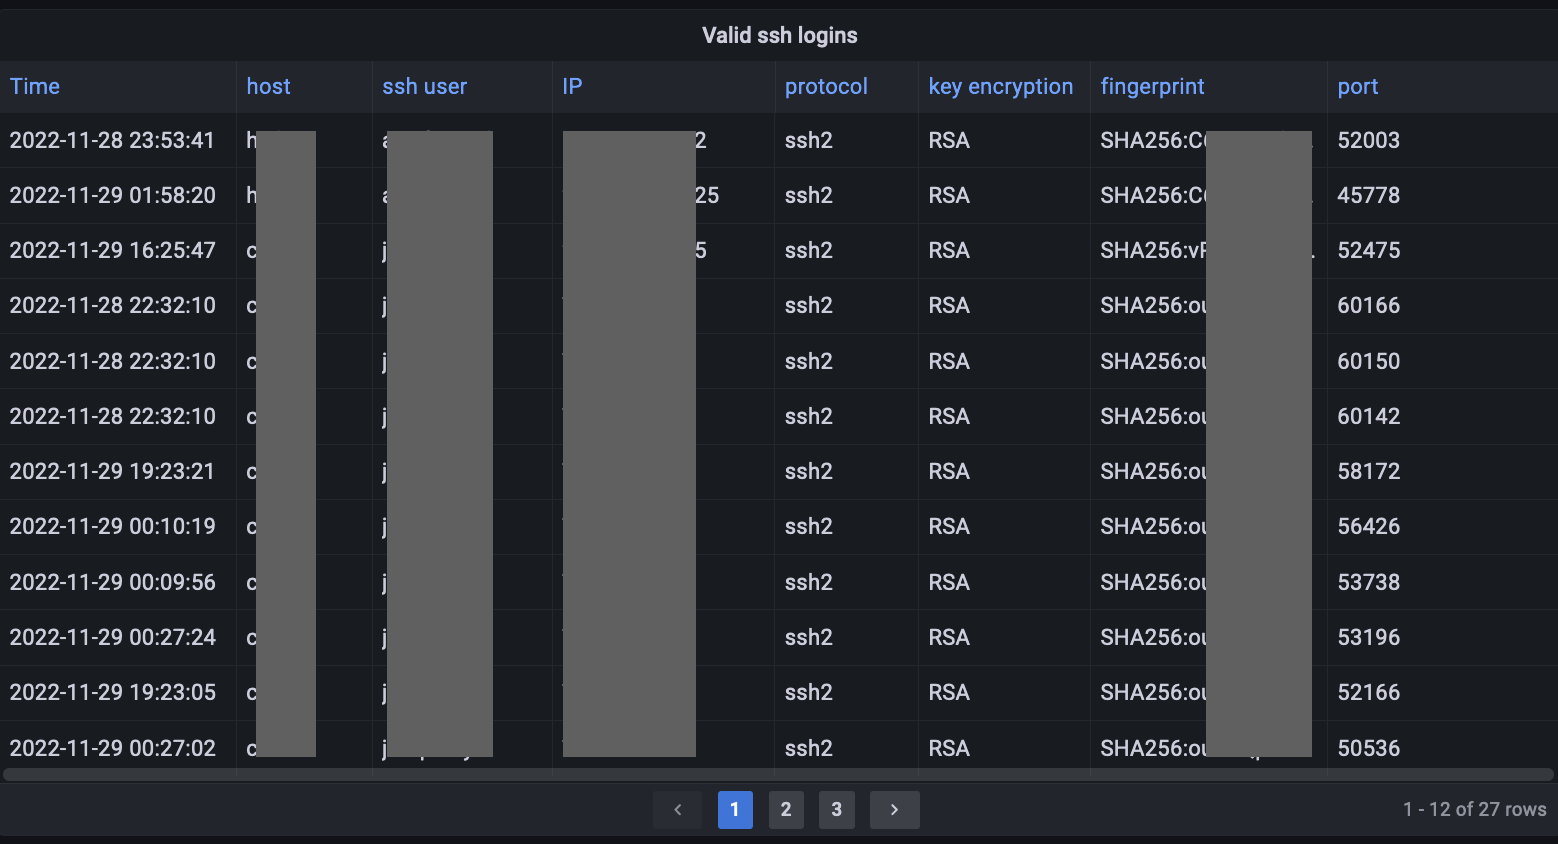
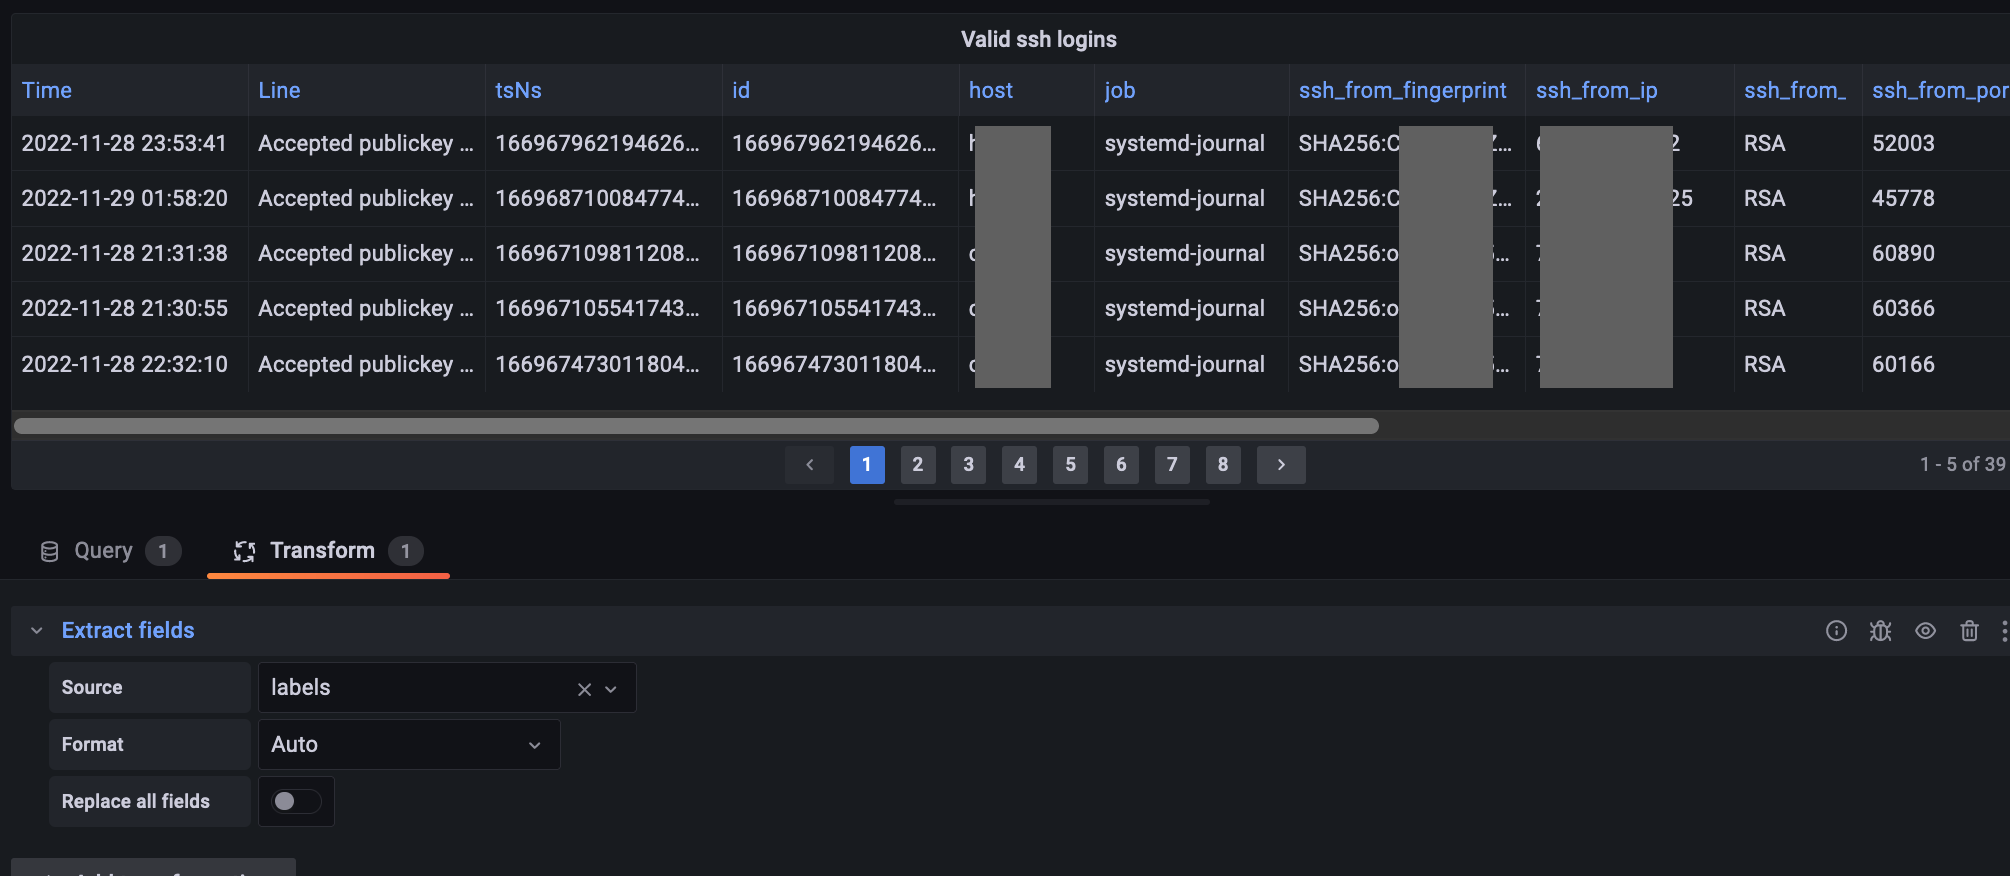
We can use transforms to show the data in a table panel appropiately.
Add a transform to extract labels:
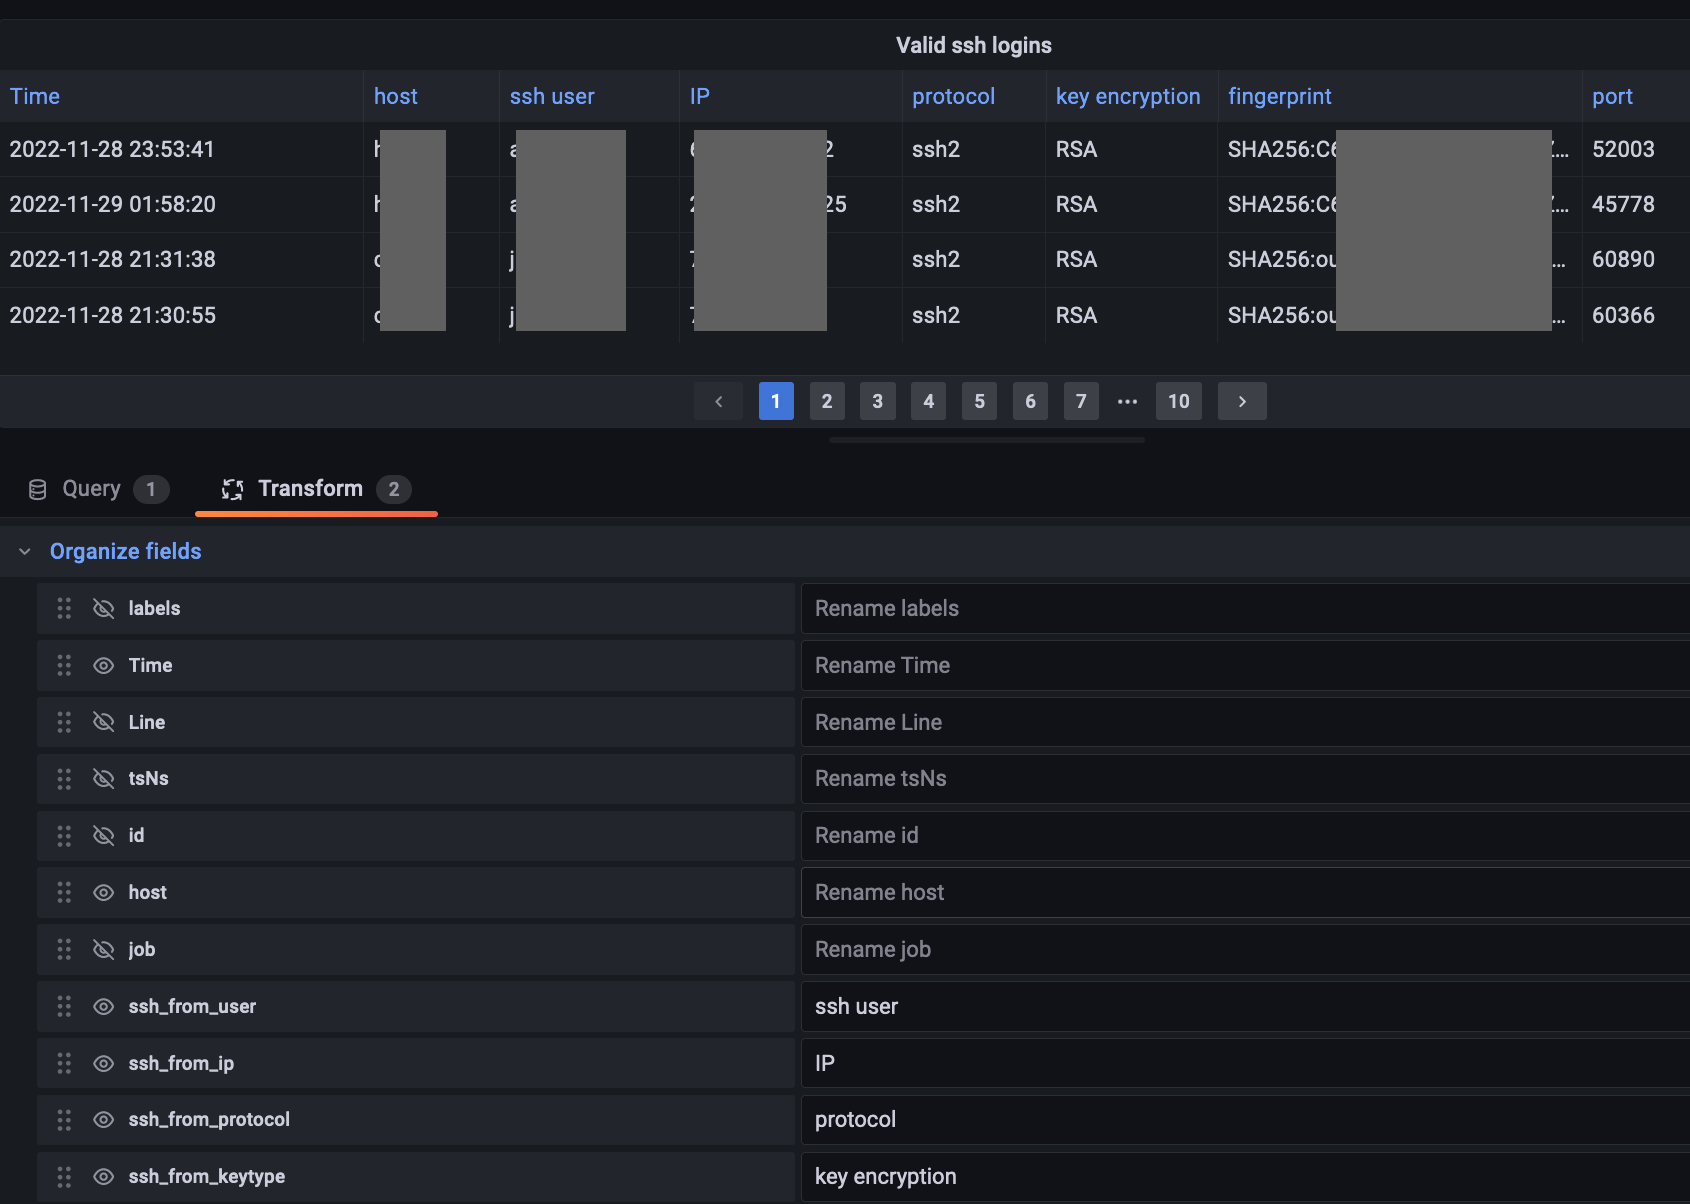
Add a transform to organize fields (chage order, hide):
Resulting table panel: